
Stocking Rate & Carrying Capacity
The number of animals, per area, for a certain period of time is known as stocking rate.
Stocking rate is the most critical decision managers can make to manage well for plant community health and livestock weight gain, and protect rangeland health in drought1.
The Rangeland Analysis Platform (USDA-ARS) is a new satellite tool that allows us to estimate rangeland productivity!
What is the Rangeland Analysis Platform?
The Rangeland Analysis Platform’s Production Explorer allows you to answer:
- How many livestock does my land support for how long?
- How does forage production change in drought, and how does that translate into reduced grazing days, AUMs, or carrying capacity?
- Made by using satellite imagery trained with hand-collected plots.
Stocking rate, grass growth and utilization
Demand Cannot Exceed Supply
- Regardless of grazing strategy (rotation, continuous, etc.), demand for forage by grazing animals cannot exceed supply.
- Supply can be challenging to calculate in Colorado because it changes year to year. There isn’t just one number on rangelands in Colorado that will be appropriate to use every year.
- The Rangeland Analysis Platform’s Production Explorer allows you to see how past droughts have impacted production, and real-time growth curves during the growing season.
Harvest Efficiency Rate vs. Utilization
“The grass doesn’t know what bit it.”
In calculating available forage for intake by livestock, managers plan on using only 25%-30% of the total forage to protect land health and grass vigor.
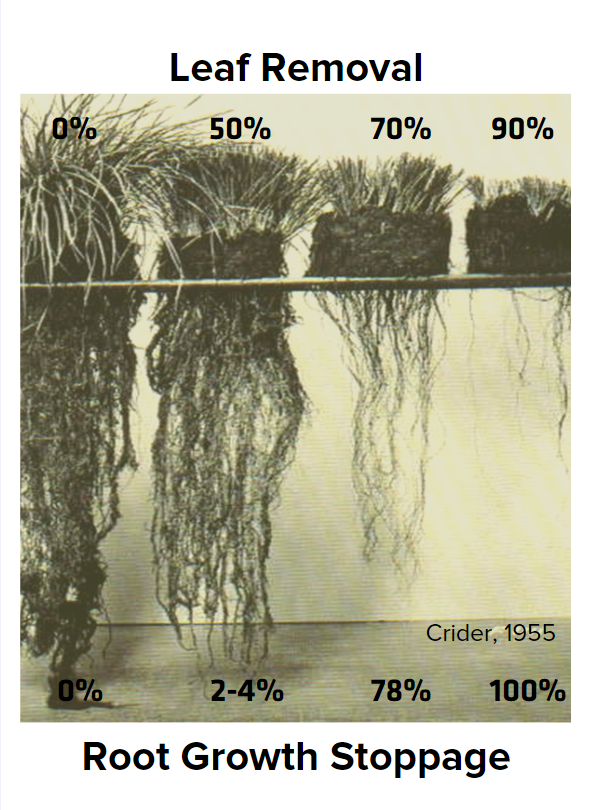
- Grass recovery and resilience declines drastically beyond 50% use by weight (i.e., forage removal2).
- Utilization: The proportion of current year’s forage production that is consumed or destroyed by grazing animals2.
- Harvest Efficiency: The percentage of forage actually ingested by the animals from the total forage produced3.
- With 25% ingestion by livestock, managers plan that 50% will be removed from the plant because some will be lost to trampling, deification, and wildlife use.
- Planning to ‘consume’ more would reduce in overuse, which subsequently reduces the amount of regrowth by plants.
- Leaving forage behind can help protect the land from erosion and ensure that it is productive in the future.
References
- Briske, D. D. (2011). Conservation benefits of rangeland practices: assessment, recommendations, and knowledge gaps. Available at: https://nrcspad.sc.egov.usda.gov/DistributionCenter/product.aspx?ProductID=877
- Crider, F. J. (1955). Root-growth stoppage resulting from defoliation of grass (No. 1102). US Department of Agriculture.
- Technical Note Range No. 73